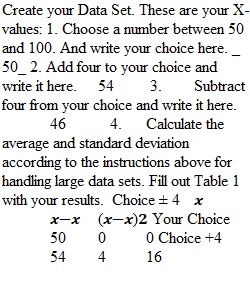
Q Measurements Lab Introduction: Nobody is perfect. And no measurement is perfect. It will always be a little off. There are two way measurements can be off. The first way is random error and the second is bias. Random error is just what it sounds like: The value you measure differs from the true value by some random amount. It could be large or small and is equally likely to be above or below the true value. A poorly-made bathroom scale may show different weights each time you stand on it. Poorly-fitting parts cause a degree of randomness in the measurements. The second way measurements can be off is bias. This is a consistent deviation from the true value and is usually due to some aspect of the measurement process. Think of a bathroom scale that always reads five pounds more than the true weight of anyone standing on it. Accuracy is defined as how closely a measured value is to some true value. The weight read off an accurate bathroom scale would be very close to the true value of some weight placed on it. This can be tested by placing some known, standard weight on the scale and comparing the reading on the scale to that true weight. Precision is defined as how closely measured values are to each other. A poorly-made bathroom scale may show weights that are all over the place. A good scale consistently shows your weight within a few of pounds or kilograms. This scale would have higher precision. It turns out that variation in nature is fairly common. Not just as a matter of measurement but in the way things form or grow. For this reason, scientists have developed methods to measure and describe this variation. Two common values used to summarize data that varies are the average and the standard deviation. The average is just a way to give an overall, central value to a data set that varies over some range. The standard deviation is a value used to describe the size of the range and how much the data varies over that range. Procedures for calculating average and standard deviation are shown below. Average and Standard Deviation Calculating the Average: Sometimes it is helpful to summarize data in a way to make it easier to understand. Or to have a single value that is representative of a group. How big is an elephant? It depends on the elephant: some are bigger than others. You can get a meaningful size by taking the average. To find the average, follow these steps: 1. Add up all your measurements. 2. Divide by the total number of measurements you counted. Here is the formula for the average in words: Average = Sum of Measurements ÷ Number of Measurements The formula for the average is typically written as follows: x ?= (??x)/n The x with the line over is the average. It is called “x – bar”. The vaguely E-shaped symbol (?) in the numerator of the fraction is the Greek letter sigma. Think of it like the capital letter S but in Greek. It means “sum” and that means you add up all the values for the variable (in this case x) that follows. The values for x in the first example below are -4, 2, 5, 5, 8 and 14. The n in the denominator is the number of x-values that you are adding up. In this case, n = 6. Average Example: Find the average of the following measurements: –4, 2, 5, 5, 8, 14 1. Add up all your measurements: –4 + 2 + 5 + 5 + 8 + 14 = 30 2. Divide the sum of measurements by the number of measurements. In this example, there are 6 measurements. Average = 30/6 = 5 Calculating the Standard Deviation: Another aspect you may wish to summarize is the amount of variability in your data set. Elephants are not all the same size. By how much do they differ? The standard deviation is a common measure of this variability. The formula below shows how to calculate the standard deviation (SD). ______________________________________________________ SD = ? ?(each measurement – average)2 ÷ (number of measurements – 1) Each measurement minus the average is the deviation from average for each measurement and they each get squared. The “? “ symbol means you add up each squared deviation. To find the standard deviation, follow these steps: 1. Subtract each measurement from the average. 2. Square each subtracted measurement. 3. Add up the numbers you just squared. 4. Divide the added up squared values by the total number of measurements you counted minus one. 5. Take the square root of this value. The formula for the average is typically written as follows: SD= ?((???(x-x ? ? )^2)/(n-1)) Standard Deviation Example: This example will use the same data as above: –4, 2, 5, 5, 8, 14. The average was already calculated to be 5. 1. Subtract each measurement from the average. –4 – 5 = -9 5 – 5 = 0 2 – 5 = –3 8 – 5 = 3 5 – 5 = 0 14 – 5 = 9 2. Square each subtracted measurement. (–9)2 = 81 02 = 0 (–3)2 = 9 32 = 9 02 = 0 92 = 81 The reason you squared the above subtractions was to get rid of the negative signs. If you add up the subtractions the way they are then you get zero - always. 3. Add up the numbers you just squared. 81 + 9 + 0 + 0 + 9 +81 = 180 4. Divide the added up squared values by the total number of measurements you counted minus one. Since we have six measurements, you divide by 5. 180/5 = 36 Steps 1 through 4 are much like taking the average. You add up numbers and divide a number close to the total number of measurements. The only other difference is you squared the numbers before adding them up. The standard deviation is a kind of average of the variability. 5. Take the square root of this value. __ Standard Deviatoin = ?36 = 6 Handling Large Data Sets: If you are finding the average and standard deviation of just a few numbers (say, five or less), then writing out the values in a formula is not a problem. As data sets get larger, it becomes helpful to write out your data and calculation values in a table. The example above is shown in the table below: x x-x ? (x-x ? )^2 –4 –9 81 2 –3 9 5 0 0 5 0 0 8 3 9 14 9 81 x ?=(??x)/n=5 ???(x-x ? ? )^2= 180 SD= ?((???(x-x ? ? )^2)/(n-1)) = 6 Additional Examples: The standard deviation is a measure of the “spread” in the data. The following examples may help you see it better. Example 1 Data set: 2, 3, 4. Average = (2 + 3 + 4)/3 = 9/3 = 3. Each value is one integer apart. SD= ?((???(x-x ? ? )^2)/(n-1))=?((?(2 - 3)?^2 + ?(3 - 3)?^2 + ?(4 - 3)?^2 )/(3-1)) =?((?(-1)?^2 + 0 +? 1?^2 )/2) = ?((1+0+1 )/2) = ?((2 )/2) =1 The SD = 1 when each data value is one integer apart. Example 2 Data set: 5, 6, 7. Average = (5 + 6 + 7)/3 = 18/3 = 6. Each value is still one integer apart. SD= ?((???(x-x ? ? )^2)/(n-1))=?((?(5 - 6)?^2 + ?(6 - 6)?^2 + ?(7 - 6)?^2 )/(3-1)) =?((?(-1)?^2 + 0 +? 1?^2 )/2) = ?((1+0+1 )/2) = ?((2 )/2) =1 The SD = 1 when each data value is one integer apart. Example 2 Data set: 4, 6, 8. Average = (4 + 6 + 8)/3 = 18/3 = 6. Each value is now two integers apart. SD= ?((???(x-x ? ? )^2)/(n-1))=?((?(4 - 6)?^2 + ?(6 - 6)?^2 + ?(8 - 6)?^2 )/(3-1)) =?((?(-2)?^2 + 0 +? 2?^2 )/2) = ?((4+0+4 )/2) = ?((8 )/2) =2 The SD = 2 when each data value is two integers apart. Example 3 Data set: 3, 6, 9. Average = (3 + 6 + 9)/3 = 18/3 = 6. Each value is now three integers apart. SD= ?((???(x-x ? ? )^2)/(n-1))=?((?(3 - 6)?^2 + ?(6 - 6)?^2 + ?(9 - 6)?^2 )/(3-1)) =?((?(-3)?^2 + 0 +? 3?^2 )/2) = ?((9+0+9 )/2) = ?((18 )/2) =3 The SD = 3 when each data value is three integers apart. There is nothing particularly special about this formula. There could be other formulas that could work equally well as a measure of spread in a data set. I chose the examples above because the math happens to work out nice. Calculate the Average and Standard Deviation: Typically, I’d have you find five objects of the same kind in nature and measure their length (with a cm ruler) or weight (if you have access to a scale). You would then use those essentially random lengths or weights to calculate the average and standard deviation. I thought I’d try something different this time: You will start with three data points such that the calculations will be easy. I’m hoping this will help you understand the “workings” behind the formula for standard deviation. Create your Data Set. These are your X-values: 1. Choose a number between 50 and 100. And write your choice here. _____ 2. Add four to your choice and write it here. _____ 3. Subtract four from your choice and write it here. _____ 4. Calculate the average and standard deviation according to the instructions above for handling large data sets. Fill out Table 1 with your results. Table 1. Average and Standard Deviation Choice ± 4 x x-x ? (x-x ? )^2 Your Choice Choice + 4 Choice – 4 x ?=(??x)/n=______ ???(x-x ? ? )^2= ______ SD= ?((???(x-x ? ? )^2)/(n-1)) = _____
View Related Questions